
How to Read a Pump Curve: Duty Point, BEP and the System Curve
A pump curve is the single most useful document in pump selection, and also one of the most misread. Dealers, contractors and buyers often pick a pump because its maximum head or maximum flow looks right, then wonder why it runs noisily, trips its motor or delivers less water than expected. This guide explains how to read a centrifugal pump curve properly and how to find where a pump will actually operate.
What the axes mean
The horizontal axis shows flow (Q), usually in cubic metres per hour, litres per second or litres per minute. The vertical axis shows head (H) in metres. Head is the height the pump could lift the liquid, and it already includes the effect of the liquid’s density, so a pump produces the same head in metres whether it pumps water or a slightly heavier liquid. The pressure it creates, and the power it needs, do change with density.
A published curve is valid for one speed (for example 2900 rpm on 50 Hz) and one impeller diameter. Many catalogues show several curves on one chart for different impeller diameters or stages.
The head–flow curve
For a typical centrifugal pump, head is highest at zero flow, called shut-off head, and falls as flow increases. The pump never chooses its own flow. It runs wherever its curve meets the resistance of the system it is connected to.
The system curve
The system curve describes how much head the pipework needs at each flow. It has two parts:
- Static head: the vertical lift from the water level to the discharge point, plus any pressure needed at the outlet. It does not change with flow.
- Friction head: losses in pipes, bends, valves and fittings. In turbulent flow, these rise roughly with the square of the flow, so doubling the flow roughly quadruples the friction loss.
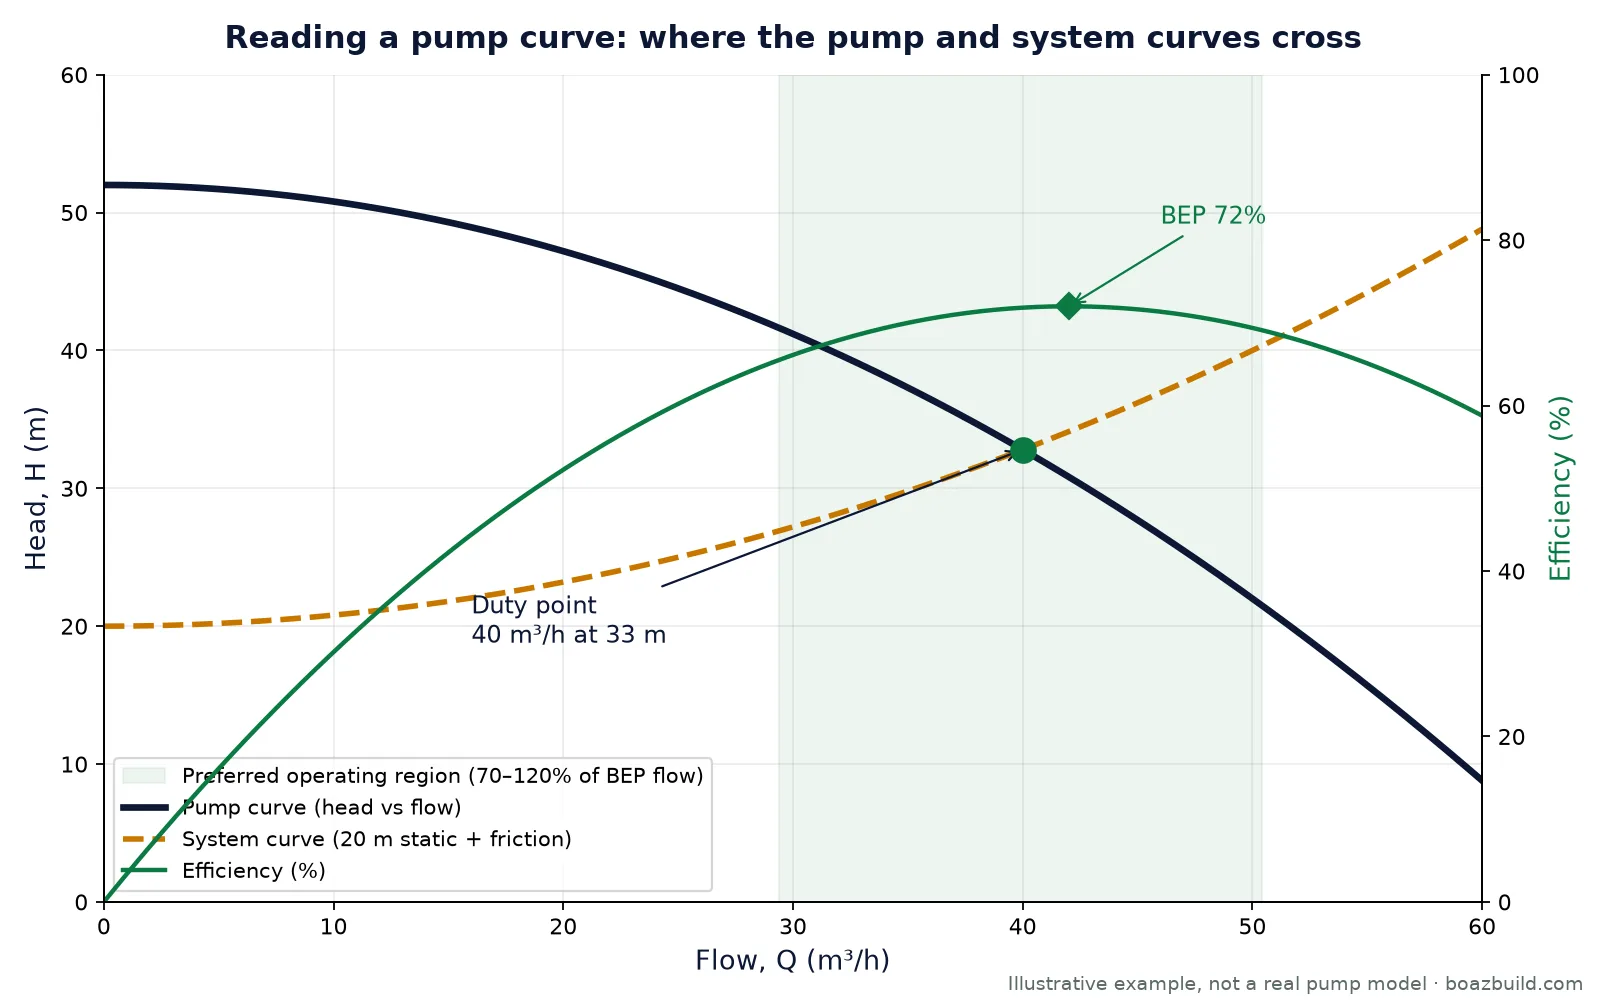
That is why the system curve starts at the static head and bends upwards, as the dashed line in the diagram shows.
The duty point
The duty point is where the pump curve and the system curve cross. In the illustrative example above, the pump delivers 40 m³/h at about 33 m of head. If the customer actually needs 45 m³/h, this pump in this system will not provide it, no matter what the catalogue headline says. To move the duty point you must change the pump (speed, impeller or model) or change the system (pipe size, valve setting or route).
Efficiency and the best efficiency point (BEP)
Most curves also show an efficiency line, which rises to a peak and then falls. That peak is the best efficiency point (BEP). Running close to the BEP gives the lowest energy use per litre and the lowest wear, because the flow through the impeller and casing matches their design.
Industry guidance, such as the Hydraulic Institute’s preferred operating region, recommends running roughly between 70 and 120 percent of the BEP flow for most centrifugal pumps. The shaded band in the diagram shows that region. A good selection puts the duty point inside it, ideally slightly to the left of the BEP so that a little extra system resistance later does not push it out.
What happens when a pump runs far from its BEP
- Too far left (low flow): internal recirculation, vibration, temperature rise in the casing and higher radial loads on bearings and seals.
- Too far right (high flow): higher risk of cavitation because the pump needs more NPSH, and on many radial pumps the power demand keeps rising, which can overload the motor.
Power and NPSH curves
Below the head curve, catalogues usually show the shaft power (P2) the pump needs at each flow, and the NPSHr (net positive suction head required). Check the power at the highest flow the pump could reach, not only at the duty point, when sizing the motor. For NPSH, the head available at the pump suction (NPSHa) must exceed NPSHr with a safety margin. If it does not, the pump cavitates, which sounds like gravel in the casing and erodes the impeller.
A worked example: from duty point to motor size
Hydraulic power is the power actually delivered to the water: P = ρ × g × Q × H. For the illustrative duty point of 40 m³/h at 32.8 m with water:
- Q = 40 ÷ 3600 = 0.0111 m³/s
- Hydraulic power = 1000 × 9.81 × 0.0111 × 32.8 ≈ 3.58 kW
- At 72 percent pump efficiency, shaft power ≈ 3.58 ÷ 0.72 ≈ 4.97 kW
The motor is then chosen from the next standard size above the maximum shaft power the pump could draw in this system, with the margin your standards require. This is exactly the kind of repetitive calculation that is easy to get wrong by hand and easy to automate.
Changing speed or impeller: the affinity laws
For the same pump, flow changes in proportion to speed, head with the square of speed, and power with the cube of speed. Reducing speed by 10 percent cuts flow by about 10 percent, head by about 19 percent and power by about 27 percent. Trimming the impeller has a similar, approximate effect. This is why variable-speed drives can save so much energy in systems with changing demand.
Pumps in parallel and in series
Two identical pumps in parallel add their flows at the same head, which suits systems that need more flow. Two in series add their heads at the same flow, which suits high-lift applications. In both cases the actual gain depends on where the combined curve meets the system curve, so the benefit is often smaller than simply doubling the numbers.
Common mistakes when reading curves
- Selecting on maximum head or maximum flow instead of the duty point.
- Ignoring friction losses and using only the static lift.
- Reading a curve for the wrong speed, frequency or impeller diameter.
- Sizing the motor only at the duty point instead of the maximum likely flow.
- Not checking NPSHa against NPSHr for suction lift applications.
Let software do the reading
Reading curves by hand is reliable when an experienced engineer has the time. When dealers, distributors and sales teams need answers quickly, pump selection software can calculate the system curve, find the duty point on every model in a range, check that it falls in the preferred operating region and size the motor in seconds. Our pump selection software guide explains how these tools work, and you can try our live demo selector, which uses sample data. If you want a selector built on your own catalogue, see pump selection software or ask for a free quote.
Frequently asked questions
What is the duty point of a pump?
The duty point is the flow and head at which a pump actually runs in a particular system. It is where the pump’s head–flow curve crosses the system curve.
What is the best efficiency point (BEP)?
The BEP is the flow at which the pump reaches its highest efficiency. Running near it gives the lowest energy use and wear. Most guidance recommends operating between about 70 and 120 percent of the BEP flow.
Why does friction head rise so quickly with flow?
In turbulent flow, friction losses rise roughly with the square of the velocity. Doubling the flow through the same pipe therefore roughly quadruples the friction loss.
How do I calculate the power a pump needs?
Hydraulic power is density × gravity × flow × head. Divide it by the pump efficiency to get the shaft power, then choose a motor above the maximum shaft power the pump could draw in your system.


0 comments
No comments yet. You can start the conversation.